Monitoring student engagement in Blackboard

While working with students remotely, there are ways to check learner engagement within Blackboard. Here are 4 examples.
1. Check when a student last accessed your course unit
Go to Full Grade Centre. The column called Last Access displays the date a learner last logged on, you can click the column header to put this information in date order.

If the Last Access column isn’t visible in Grade Centre it may have been hidden. To make it visible. In Full Grade Centre click on Manage > Column Organisation tick the box next to the Last Access and use the Show/Hide button at the bottom of the page to toggle the column visibility. Click on Submit
2. Set up a Smart View to view students by last access date
It’s possible to use the Smart View feature to only view students who have not accessed your course by a specific date. For details on how to do this see: Setting up a Smart View for Last Access
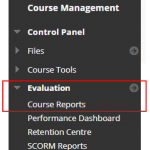
3. Run one of Blackboard’s in built course reports
Using the left hand menu, go to Course Management> Evaluation> Course Reports
Here you will see a list of course report types, e.g.
- All User Activity inside Content Areas displays a summary of all user activity inside content areas for a course. Use this report to determine which learners are active in your course and which content areas they use. PROBABLY THE MOST USEFUL
- Course Activity Overview displays overall activity within a single course, sorted by learner and date. Data includes the total and average time spent per active learner and the total amount and type of activity each learner had in the course. Optionally, you can filter the report by one or more groups. Only learners who are members of the selected groups are included in report results.
- Course Coverage Report displays data on course items that have been aligned to goals.
- Course Performance displays how a single course performs against a selected set of goals.
- Overall Summary of User Activity displays user activity for all areas of your course, as well as activity dates, times, and days of the week. Use this report to view learner access as well as how often course tools are used.
- Single Course User Participation Report displays the number of user submissions in your course for assignments, tests, discussions, blogs, and journals within the chosen time frame. You don’t need to grade an item for data to be included in the report. The data is provided in a Microsoft® Excel® spreadsheet (XLS).
Decide which report you wish to run and using the chevron on the right, run the report.
Choose the report specifications and Submit
Save the report or run a new one with different criteria.